Edit chart
Loading graph
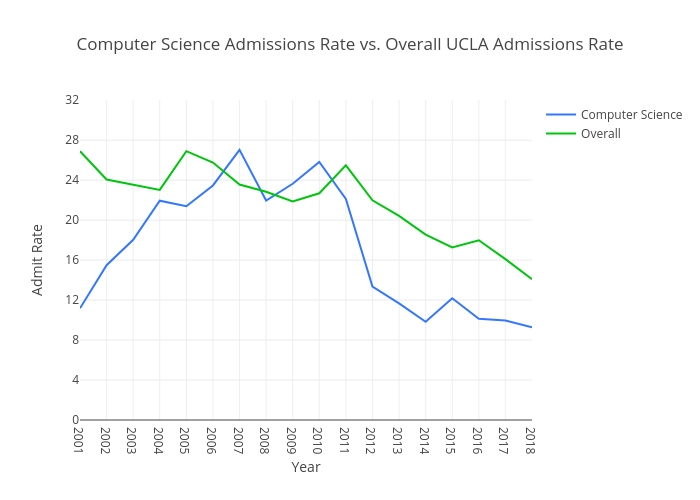
Keithatienza19's interactive graph and data of "Computer Science Admissions Rate vs. Overall UCLA Admissions Rate" is a line chart, showing Computer Science vs Overall; with Year in the x-axis and Admit Rate in the y-axis.. The x-axis shows values from 2001 to 2018. The y-axis shows values from 0 to 32.023415977961434.